Understanding the Firefox Dev Tools Architecture, and How to Start Contributing
This year I decided to contribute more to open source projects and since I've made the resolution to switch to Firefox from Chrome I've also got the chance to find an interesting bug to work on.
In this post I want to share my learnings in the hope that more people could start contributing to Firefox.
Contributing to Firefox: a bit of backstory
In Firefox Dev Tools I wanted a "Store as global variable" option in the Scopes panel. The Scopes panel appears in the debugger tab when you stop the script with a breakpoint, much like Chrome Dev Tools.
As of now the only thing that you can do on an object in the panel is adding a watchpoint, that is, a watcher which fires on properties get and set. You can read more about watchpoints here.
What I wanted as a bonus was a "Store as global variable" à la Chrome. In the Chrome Dev Tools you can store as global not only the innermost objects, but the topmost entities as well.
With the idea in mind I reached the Firefox Dev Tools account on Twitter and the team replied promptly with a workaround.
But it turns out there was already a bug filled for the feature I wanted: Variables/values in Scopes should offer reps context menu.
So I jumped in and I tried to work on the bug. But before going into details let's see how to get started in contributing to Firefox Dev Tools.
Enjoy!
Contributing to Firefox: how to get started
If you want to start contributing to Firefox your first stop must be the contributor guide. Also, join the Slack channel.
Read every section of the guide carefully and try to not skip anything. There are great insights into the Firefox Developer Tools architecture, but I know, you want to get your hands dirty.
Clone the repo (you'll need Mercurial) and make yourself comfortable with the codebase. It is big, and you'll need a lot of reading through the source code before starting to grasp anything.
Don't try to rush it, don't be like me. Your first patch will be likely need changes because you don't know how Firefox Dev Tools works under the hood.
But that's a good thing because learning from such a big codebase and interacting with more expert developers is invaluable.
After cloning the repo and glancing through the code it will come the time to create your first patch. But first, let's demystify the architecture of Firefox Dev Tools.
Firefox Dev Tools frontend: the architecture
The Firefox Dev Tools frontend is a big React/Redux app made of many little apps. For that reason you'll need a good understanding of Redux Redux, namely:
- reducers
- actions
- middleware
- store enhancers
- selectors
Every tab in the developer tool is a React/Redux app which lives in a separate folder in mozilla-central/devtools/client. Here's a breakdown:
$ tree -d -L 1 devtools/client/
devtools/client/
├── aboutdebugging
├── accessibility
├── application
├── bin
├── debugger
├── dom
├── framework
├── inspector
├── jsonview
├── locales
├── memory
├── netmonitor
├── performance
├── performance-new
├── preferences
├── responsive
├── shared
├── storage
├── styleeditor
├── themes
├── webconsole
├── webreplay
└── whats-new
You can recognize each tab: debugger, inspector, memory, netmonitor, performance, and so on.
As you'll find out by going through, each application follows more or less the same directory structure. Inside each app you'll find:
- React components
- Redux actions, reducers, and so on
- tests
- utilities
There are also a lot of other folders which I won't cover here, but you can learn more by checking out this link.
Worth noting, each tab in the developer tool is also a panel. The debugger for example is in devtools/client/debugger/panel.js.
On top of that, the entirety of each panel grouped together is called toolbox and is defined in devtools/client/framework/toolbox.js.
The toolbox is in practice the entire dev tool window. Each panel gets access to the toolbox, which is injected at runtime. The debugger panel for example takes toolbox as a parameter:
// devtools/client/debugger/panel.js
function DebuggerPanel(iframeWindow, toolbox) {
  this.panelWin = iframeWindow;
  this.panelWin.L10N = L10N;
  this.toolbox = toolbox;
}
Same is true for the inspector panel:
// devtools/client/inspector/panel.js
function InspectorPanel(iframeWindow, toolbox) {
  this._inspector = new iframeWindow.Inspector(toolbox);
}
Turns out, this frontend is only the tip of the iceberg. There is also a Firefox Dev Tools backend. We'll get to it later: let me show you my first attempt to implement "Store as global variable".
TIP: to browse the codebase you can also use Searchfox.
Store as global variable: a first attempt
After building Firefox (instructions here) I started off by looking around in devtools/client/debugger.
I found out my entry point in devtools/client/debugger/src/components/SecondaryPanes/Scopes.js.
This component is responsible for displaying Scopes, and has already a context menu for adding watchpoints.
I started off by adding a new entry named "Store as global variable" to the menu. Here's the relevant part:
  onContextMenu = (event: any, item: any) => {
    const {
      addWatchpoint,
      removeWatchpoint,
      storeAsGlobalVariable,
    } = this.props;

    // omitted for brevity

    const storeAsGlobalVariableItem = {
      id: "node-menu-store-as-global",
      label: storeAsGlobalLabel,
      disable: false,
      click: () => storeAsGlobalVariable(item),
    };

    const menuItems = [storeAsGlobalVariableItem, watchpointsSubmenuItem];
    showMenu(event, menuItems);
  };
The menu appears in response to the contextmenu event.
The Scopes component talks to the Redux store, that means it has access to actions.
So I've added a new action in devtools/client/debugger/packages/devtools-reps/src/object-inspector/actions.js:
function storeAsGlobalVariable(item) {
  return async function({ panel }) {

  // omit for brevity

    await panel.storeAsGlobalVariable(selectedObjectActor);
  }
}
With the help of Nicolas from the Firefox team I've got a first proof of concept. There is a lot more going on in this action and I've omitted some code for brevity's sake, but if you're familiar with Redux you can recognize a thunk.
Thunk is a middleware, and as for the project is configured each thunk has access to the panel.
If you remember from the previous section a panel is a dev tools tab. In this case panel is the debugger tab.
What happens in this action is that it takes item as a parameter and computes a selectedObjectActor. In brief, the item is the actual thing that has been clicked in the Scopes panel. selectedObjectActor instead is a reference (a string) that we need to pass to the server.
Yes, there is a server. In the next section I'll describe what I learned about it, while trying to explain how the entire architecture works.
Worth noting, most of the codebase is type annotated with Flow. I'm not familiar with it, but it's not so different from TypeScript, which I use most of the times.
By the way, since it's all JavaScript don't forget to install the dependencies for any given panel you're working on (you'll need to install Yarn). In my case:
cd ~/Code/mozilla-central/devtools/client/debugger
yarn install
After making changes don't forget to build the bundle and to rebuild Firefox as well, again in my case:
cd ~/Code/mozilla-central/devtools/client/debugger
node bin/bundle.js
~/Code/mozilla-central/mach build
Now you can run Firefox with:
~/Code/mozilla-central/mach run
# or simply ./mach run if you're in the same folder
The build produces a version of Firefox called Nightly. I use Firefox Developer Edition for development, Nightly is similar, but includes all the newest features. To learn more about all the Firefox versions check out out this video by Jen Simmons.
Firefox Dev Tools server: the architecture
As I said, the Firefox Dev Tools frontend is only the tip of the iceberg. Each panel in fact is a client, and has a corresponding actor on the server.
That means there is the webconsole actor, the inspector actor, the network actor, and so on. It's not a 1:1 match, the debugger panel for example talks to the thread actor, but, you got the point.
Actors are defined in devtools/server/actors. The term actor refers also to any object that is being debugged (the debuggee).
In my action for example I passed a selectedObjectActor:
function storeAsGlobalVariable(item) {
  return async function({ panel }) {

  // omit for brevity

    await panel.storeAsGlobalVariable(selectedObjectActor);
  }
}
Here selectedObjectActor will be a string like:
"server0.conn0.child1/obj464"This string is used by the client to tell the server "ehi, please, tell me about this object and give me back the result".
The thing to keep in mind then is that it's not the Dev Tool frontend that evaluates the actual JavaScript code.
Everything lives on the server-side and client panels talk to the server via JSON objects. Then it's the server-side of Dev Tools that talks to the Firefox JavaScript engine (SpiderMonkey) and reports back to the client panel if asked.
You can read more about the Debugging protocol architecture here.
Now after introducing server and panels it's time to see how all these components interact.
Firefox Dev Tools: from the toolbox to the server
Let's take a look again at the action:
function storeAsGlobalVariable(item) {
  return async function({ panel }) {

  // omit for brevity

    await panel.storeAsGlobalVariable(selectedObjectActor);
  }
}
panel is a thunk argument and maps to devtools/client/debugger/panel.js, the actual debugger panel.
If you look at the source code you can see that the constructor function for DebuggerPanel takes toolbox among the parameters. Toolbox is at devtools/client/framework/toolbox.js and has an openSplitConsole method.
That was exactly what I was searching for. Also, by looking at how the "Use in console" feature works in the inspector I tried to replicate the same feature. That lead me to create this new method in devtools/client/debugger/panel.js:
  storeAsGlobalVariable: async function(selectedObjectActor) {
    await this.toolbox.openSplitConsole();
    const { hud } = this.toolbox.getPanel("webconsole");

    const script = `{ let i = 0;
      while (this.hasOwnProperty("temp" + i) && i < 1000) {
        i++;
      }
      this["temp" + i] = _self;
      "temp" + i;
    }`;

    const thread = this._selectors.getCurrentThread(this._getState());
    const { id } = this._selectors.getSelectedFrame(this._getState(), thread);

    const options = {
      selectedObjectActor,
      frameActor: id,
    };

    const res = await hud.evaluateJSAsync(script, options);
    hud.setInputValue(res.result);
  },
This method bears a bit of explanation. First, it receives selectedObjectActor from the Redux action. Next up it opens the split console, that is, the little console you can see some times in the Dev Tool.
It also hooks the webconsole panel which returns itself as hud.
You can also notice the script for creating a new global variable. Before forwarding the script for evaluation to the server this method computes also the frameActor id.
We already saw what is selectedObjectActor, a reference to an object in the Scope panel. The frameActor id is another string:
server0.conn0.child1/frame26In particular it is a reference to the context where we are currently in. In other words if I pause a script with the debugger, that context where the script is paused is the actual frame.
These two references, selectedObjectActor and frameActor are needed by an actor which lives in the server. More on this in the next section.
Store as global variable: the working POC
This part required the help of Nicolas. Let's look again at the previous method:
  storeAsGlobalVariable: async function(selectedObjectActor) {
    // omitted for brevity
    const options = {
      selectedObjectActor,
      frameActor: id,
    };

    const res = await hud.evaluateJSAsync(script, options);
    hud.setInputValue(res.result);
  },
Long story short, the call to hud.evaluateJSAsync is forwarded to the server and lands on evalWithDebugger defined in devtools/server/actors/webconsole/eval-with-debugger.js.
This function required a tweak because it prevented _self from being defined. _self is used by the server as a placeholder during evaluation. Here _self is replaced by the actual object:
    const script = `{ let i = 0;
      while (this.hasOwnProperty("temp" + i) && i < 1000) {
        i++;
      }
      this["temp" + i] = _self;
      "temp" + i;
    }`;
When the evaluation is done the appropriate object is assigned to a temporary variable named tempo0, temp1, and so on.
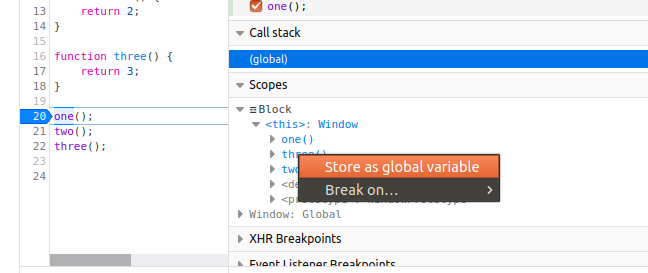
And with the fix in place (you can see the history here) I've got a working proof of concept:
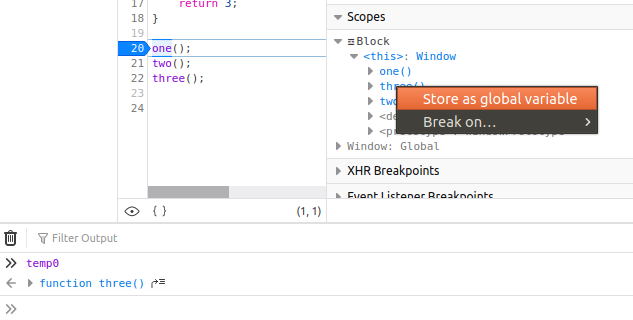
When the script is paused and the Scopes panel is opened I can (in my build for now) save an object in a global variable after the split panel opens.
Conclusions
Firefox is a fantastic browser and the developers tools are second to none.
At the time of writing the feature is far from finished, there are some edge cases to cover. But I was eager to share this little open source story to clarify my understanding about such a big system.
Acknowledgments
Thanks to Jason Laster and Nicolas Chevobbe for answering to my questions and providing guidance on my first patch for Firefox.