Debugging async Django under Uvicorn with Pycharm
If you deploy Django async under ASGI, chances are you need an ASGI server like Uvicorn.
In production, you can use Uvicorn with Gunicorn, but in development you might want to use Uvicorn standalone, which can also run programmatically from a Python script.
This gives also the ability to debug your asynchronous Django project locally with any IDE. In this short guide you'll learn how to debug Django under Uvicorn with Pycharm.
Running Uvicorn programmatically
As a first step, create a Python script in your project root. I call mine server.py. In this file we import and run Uvicorn:
import uvicorn

if __name__ == '__main__':
    uvicorn.run("async_django.asgi:application", reload=True)
Here I assume we have a Django project in the async_django folder, where we can also find a file named asgi.py, which is the ASGI application for our Django project.
Once the script is ready we move to configure Pycharm.
Configuring Pycharm to debug Django
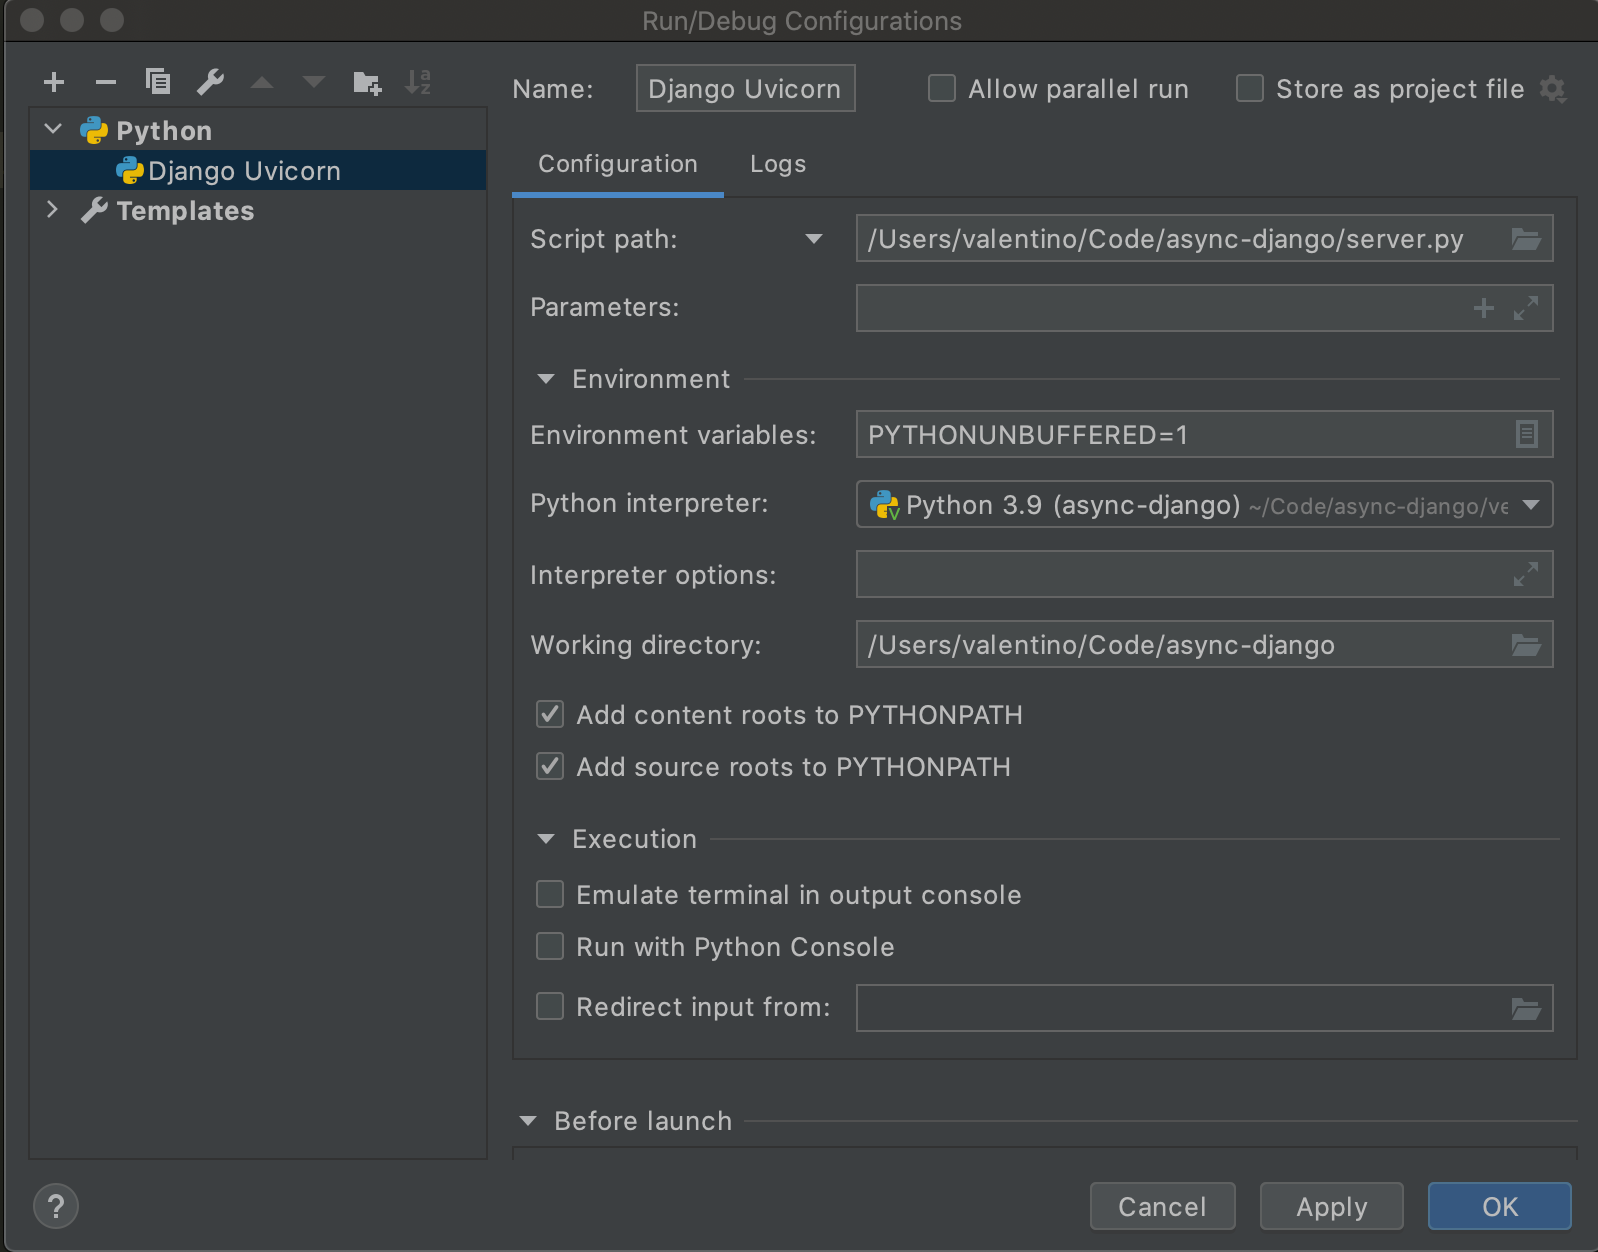
In Pycharm, open up the Run menù and click on Edit configurations. Here we create a new configuration for Python, to run our server.py:

The Script path configuration should point to the path where server.py lives.
Once done you're ready to debug your Django async project.
Debugging async Django under Uvicorn with Pycharm
Suppose you want to debug an asynchronous Django view like the following:
import httpx
import asyncio
from django.http.response import JsonResponse


async def all_users():
    async with httpx.AsyncClient() as client:
        responses = await asyncio.gather(
            *[client.get(f"https://jsonplaceholder.typicode.com/users/{i}") for i in list(range(1, 10))])
        responses = [r.json() for r in responses]
        return responses


async def index(request):
    responses = await all_users()
    return JsonResponse({"results": responses})
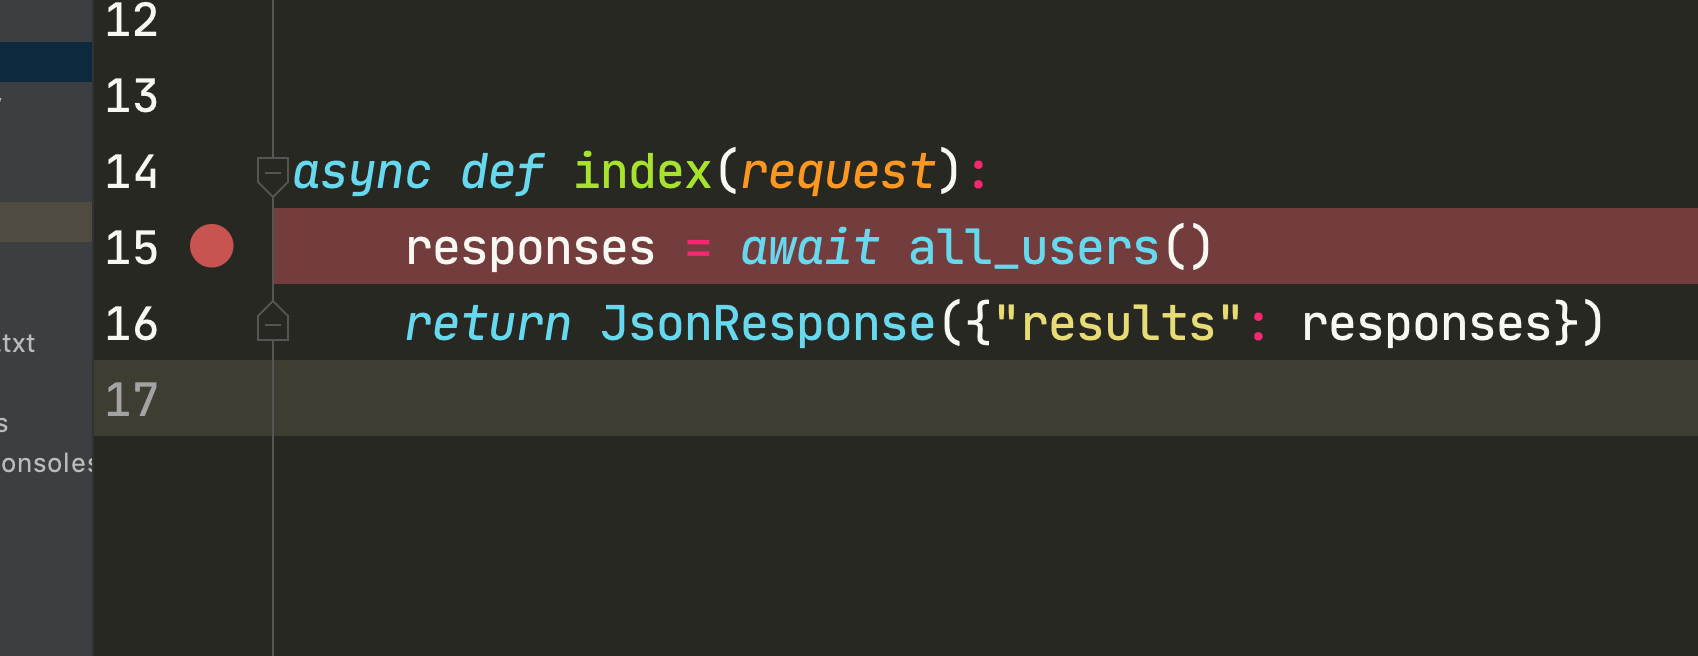
At any time you can place a breakpoint from Pycharm by clicking on the desired line:

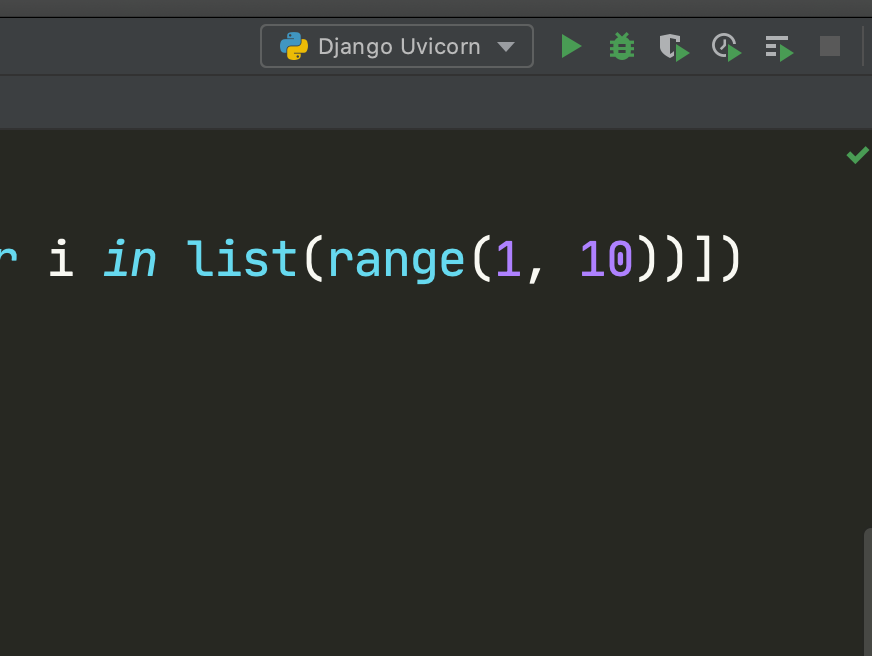
To debug the view, click on the upper right of your Pycharm interface, were you see a bug icon:

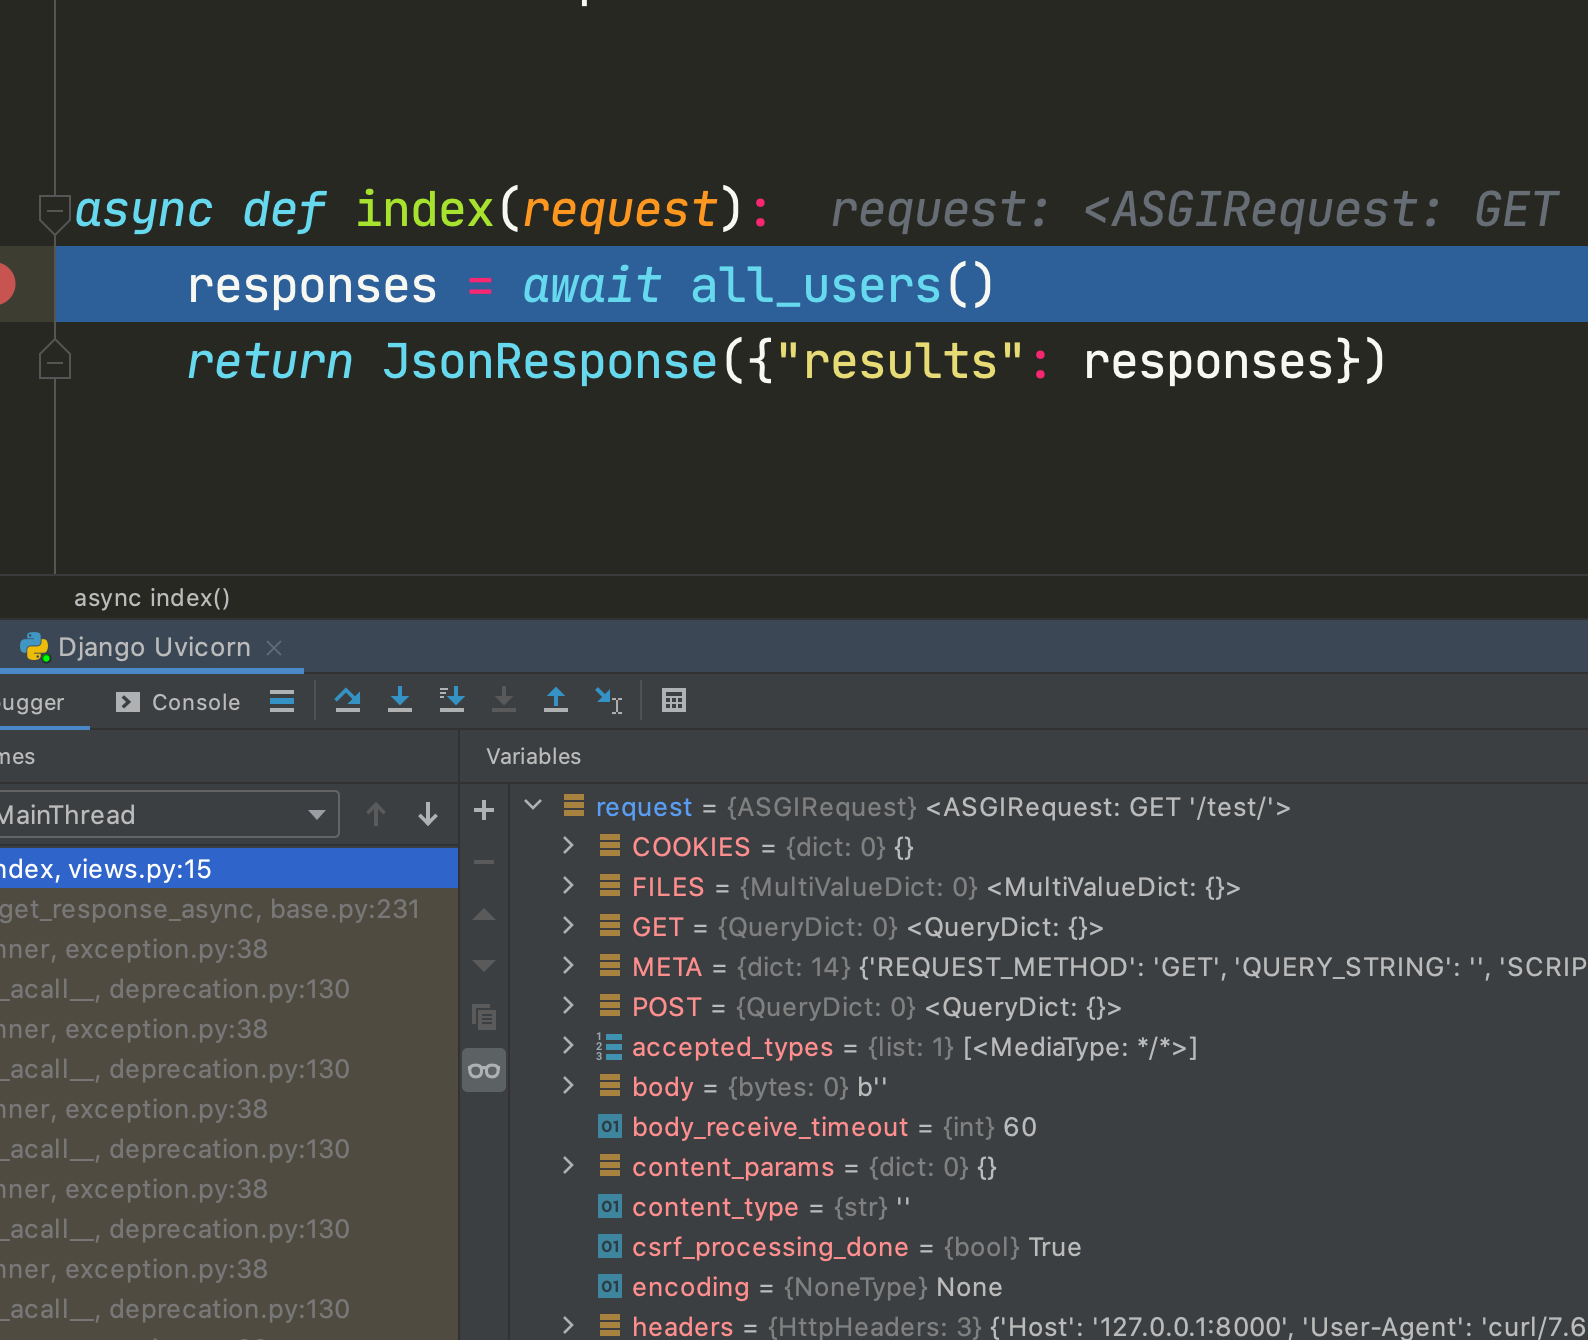
A console will open up, with your debugger ready. Now try to visit the view, and the debugger will stop exactly at the breakpoint:

From there you should be able to examine any variable, or to step over/into the execution.
